We've secured a $9M Series A funding from top B2B SaaS investors! 🎉. Read more on Techcrunch.

Weekly eCommerce Benchmarks
Compare Top KPIs by Industries

Analyze Metrics Like CAC, AOV, and ROAS with real-time data from 2,700+ Shopify Merchants
Quad lock
Aimn'
Lifetime brands
Marcella New York
The Frankie Shop
Tiege Hanley
Polene
Seavees
Ripndip
Albion Fit
Kiss USA
Konges slojd
Lemaire
nohow
Maniere de Voir
Volcom
Coes
Razor Group
Oneskin
State & Liberty
Warren James
Dyper
Bonsoirs
From Future
RSVP
Merci handy
Soi Paris
Yellowpop
Olipop
Hero
Almond Cow
Soko Glam
Fanjoy
Polène

Get your e-commerce benchmarks emailed

weekly

Uncover how your Shopify store metrics stack up. Make data-driven decisions with real-time benchmarks updated every week from over 2,000 brands.

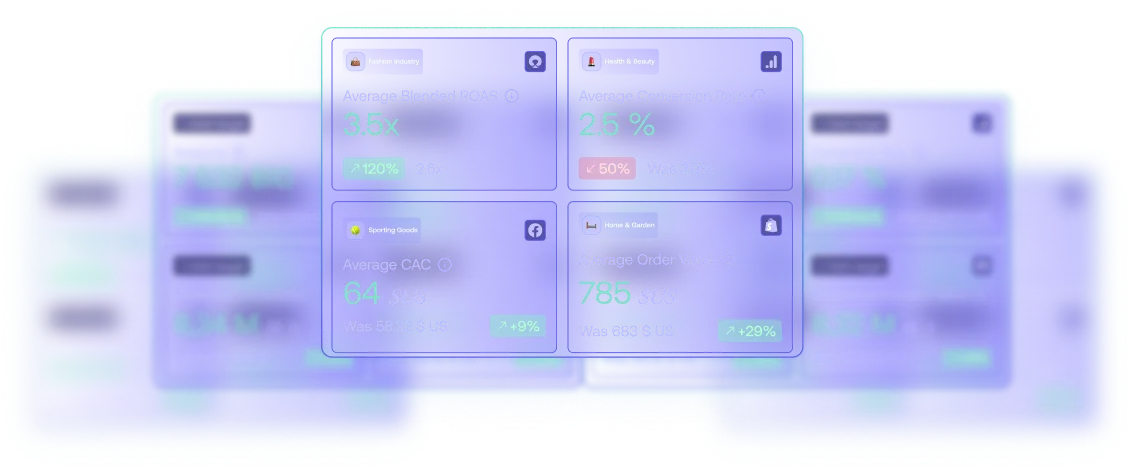
Last week benchmarks by Industries

Benchmark for fashion

Total sales decreased by 15% week-over-week, a concerning dip. The average conversion rate also decreased by 9%, indicating a drop in consumer purchasing behavior. However, the average cost of acquisition (CAC) also fell by 13%, which is a positive sign of more cost-effective marketing strategies. The average order value (AOV) increased by 7%, suggesting customers are purchasing more expensive items. The return on ad spend (ROAS) increased by 9%, demonstrating improved advertising efficiency.
fashion

Benchmark for Health & Beauty

Despite a YoY sales increase of 11.87%, there's a concerning drop in average conversion rate (-479.98% YoY). This suggests potential issues with site UX or targeting. The CAC has slightly increased (0.20% YoY), indicating costlier customer acquisition. However, ROAS has decreased by 30%, suggesting lower profitability per ad dollar spent. There's a significant decrease in AOV (-39.19% YoY), indicating customers are purchasing less expensive items. Therefore, focus on improving site conversion and profitability of ads.
Health & Beauty

Benchmark for Home & Garden

Notable surge in total sales YoY, but conversion rates dropped by 30%. This indicates higher traffic, but less efficient conversion. AOV fell slightly, suggesting lower priced items are being sold. ROAS improved by 32%, despite a decrease in Facebook Ad spend by 42%, indicating more efficient marketing spend. CAC decreased YoY, positive sign of lower cost to acquire customers. However, week over week shows a slight increase in CAC and decrease in ROAS, indicating potential inefficiencies.
Home & Garden

Benchmark for Sporting Goods

Sales dropped by 14.7% compared to last week. The conversion rate also decreased by 16.5% which suggests lower efficiency in turning visitors into customers. The increase in average CAC (41%) indicates more cost for acquiring new customers. Despite these, the AOV rose by 27.2% indicating customers are buying more expensive items. ROAS decreased by 17.7% indicating less return on ad spend. This suggests a need to optimize ad campaigns.
Sporting Goods

Join 2,700+ leading Shopify brands around the world using Polar Analytics to stop manually compiling their data

Start your free trial
Quad lock
Aimn'
Lifetime brands
Marcella New York
The Frankie Shop
Tiege Hanley
Polene
Seavees
Ripndip
Albion Fit
Kiss USA
Konges slojd
Lemaire
nohow
Maniere de Voir
Volcom
Coes
Razor Group
Oneskin
State & Liberty
Warren James
Dyper
Bonsoirs
From Future
RSVP
Merci handy
Soi Paris
Yellowpop
Olipop
Hero
Almond Cow
Soko Glam
Fanjoy
Polène

Over 100 5-star reviews

Tiege Hanley

Great app, great team! The dashboards are easy to customize to highlight our most important KPIs. Building custom reports is really easy, and our Marketing team logs in daily to analyze campaign performance. The service and support have been A+. They instantly became a critical part of our Data and Marketing tech stack.

Water and Wines

The Polar Analytics app has been an invaluable tool for optimizing our reporting. We have 5 Shopify + 1 Amazon store. But what really sets it apart is the exceptional support and onboarding team. They go above and beyond to help you make the most of the app and accommodate any business needs.

Whether you're looking to step up your reporting visuals or need in-depth analytics for your business, I highly recommend Polar Analytics.

Robin Golf

Switched over to Polar Analytics a few months ago. Before we were using Triple Whale. Polar has been great -- it gives me the same data as Triple Whale plus a lot more. The customer support from Abby has been excellent as well. Highly recommend.